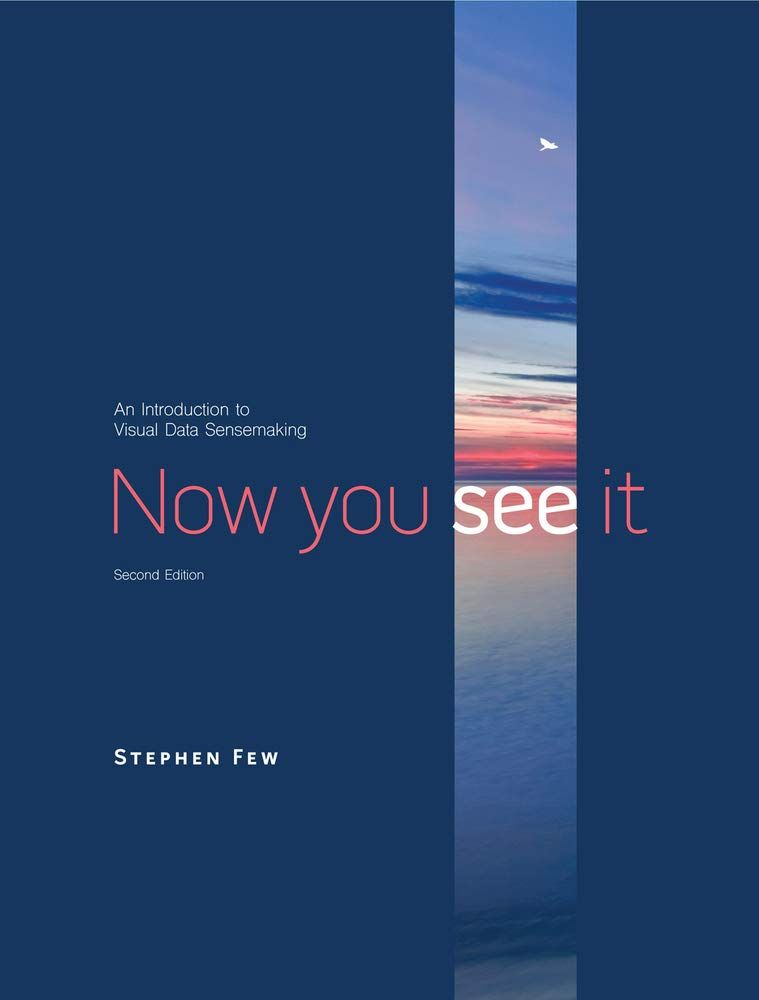
- Tags:: 📚Books , Data viz
- Author:: Stephen Few
- Liked:: 6
- Link:: Now You See It: An Introduction to Visual Data Sensemaking : Few, Stephen: Amazon.es: Libros
- Source date:: 2021-04-15
- Finished date:: 2024-02-27
- Cover::

Why did I want to read it?
A classic of data visualization… what’s not to like. Also, I think we are struggling a bit on Freepik data team with proper visualization.
What did I get out of it?
According to Stephen Few, “We have a skills problem” regarding data literacy. And Foundational models don’t seem to be the solution (as in 📜 No Silver Bullet—Essence and Accident in Software Engineering, Clean Code, and others).
Daniel Kahneman suggests that most organizations do a deplorable job of preparing for their most essential work. Whatever else it produces, an organization is a factory that manufactures judgments and decisions.
Software tools can at best assist us in performing work that we already understand. (…) Despite what technology vendors and many science fiction plots lead us to believe, computers cannot think as humans do and might never acquire this ability. (p. 2)
And Writing is thinking!
Any of these measures may play an important role, but analysis is, above all, a mental process. Traditionally, analysts at all levels devote little attention to improving how they think. To penetrate the heart and soul of the problem of improving analysis, it is necessary to better understand, influence, and guide the mental processes of analysts themselves… (p. 4)
Another that is 🗣️ Down with Data Science:🗣️ Down with Data Science:
In this book I teach quantitative data sensemaking by means of data visualization. As the words suggest, quantitative data sensemaking refers to the thoughts that we think and the things that we do to make sense of quantitative data— numbers that reveal what’s happening in our world. Several other terms are used to describe this process, including data analysis, statistics, business intelligence, and data science, but each comes with baggage and confusion that I’d rather avoid. The term data analysis suggests that the process consists entirely of breaking information down into its component parts-digging into the details-which is what analysis means, but this is only one of the activities required to make sense of data. The term statistics suggests that the process consists entirely of mathematics, which is not the case. Also, statistics tends to focus on its use in science, especially scientific research, such as its use for hypothesis testing, which is a limiting mindset. Making sense of data involves much broader thinking. The term business intelligence, even though it was originally defined in 1958 by Hans Peter Luhn as “the ability to apprehend interrelationships of presented facts in such a way as to guide action” and later in 1989 by Howard Dresner as “concepts and methods to improve decision-making using fact-based support systems,” is popularly understood by most people as little more than the production of reports. Furthermore, this work is not limited to the realm of business, so the term business intelligence is unnecessarily restrictive. The more recent term data science is an unfortunate misnomer. There are many uses of data in science, but there is no science of data. Data, in and of itself, is not the subject matter of a particular scientific domain, nor do most people who call themselves data scientists apply the scientific method in their work. (p. 5)
(To be extended)