Metadata
- Author: Erich Schubert
- Full Title:: Stop Using the Elbow Criterion for K-Means and How to Choose the Number of Clusters Instead
- Category:: 🗞️Articles
- URL:: https://arxiv.org/pdf/2212.12189
- Read date:: 2025-03-23
Highlights
Formally, k-means clustering is a least-squares optimization problem. (View Highlight)
We can best view it as a data quantization technique, where we want to approximate the data set of N objects in a continuous, d-dimensional vector space Rd using k centers. (View Highlight)
The quantization error for a data set X and a set C of centers then is called inertia, the within-cluster sum of squares (WCSS), or the sum of squared errors (SSE): SSE(X, C) = x∈X minc∈C x − c2 (View Highlight)
the problem is NP-hard for multiple clusters and higher dimensionality (View Highlight)
The standard algorithm has a complexity of O(Nkdi), where i is the number of iterations (which theoretically could be very high, but usually is small in practice). This makes it one of the fastest clustering methods we have available, compared to O(N3 +N2d) for the standard algorithm for hierarchical clustering, or O(N2d) for DBSCAN without index acceleration. (View Highlight)
 (
(There is no knee on the curve https://en.wikipedia.org/wiki/Knee_of_a_curve
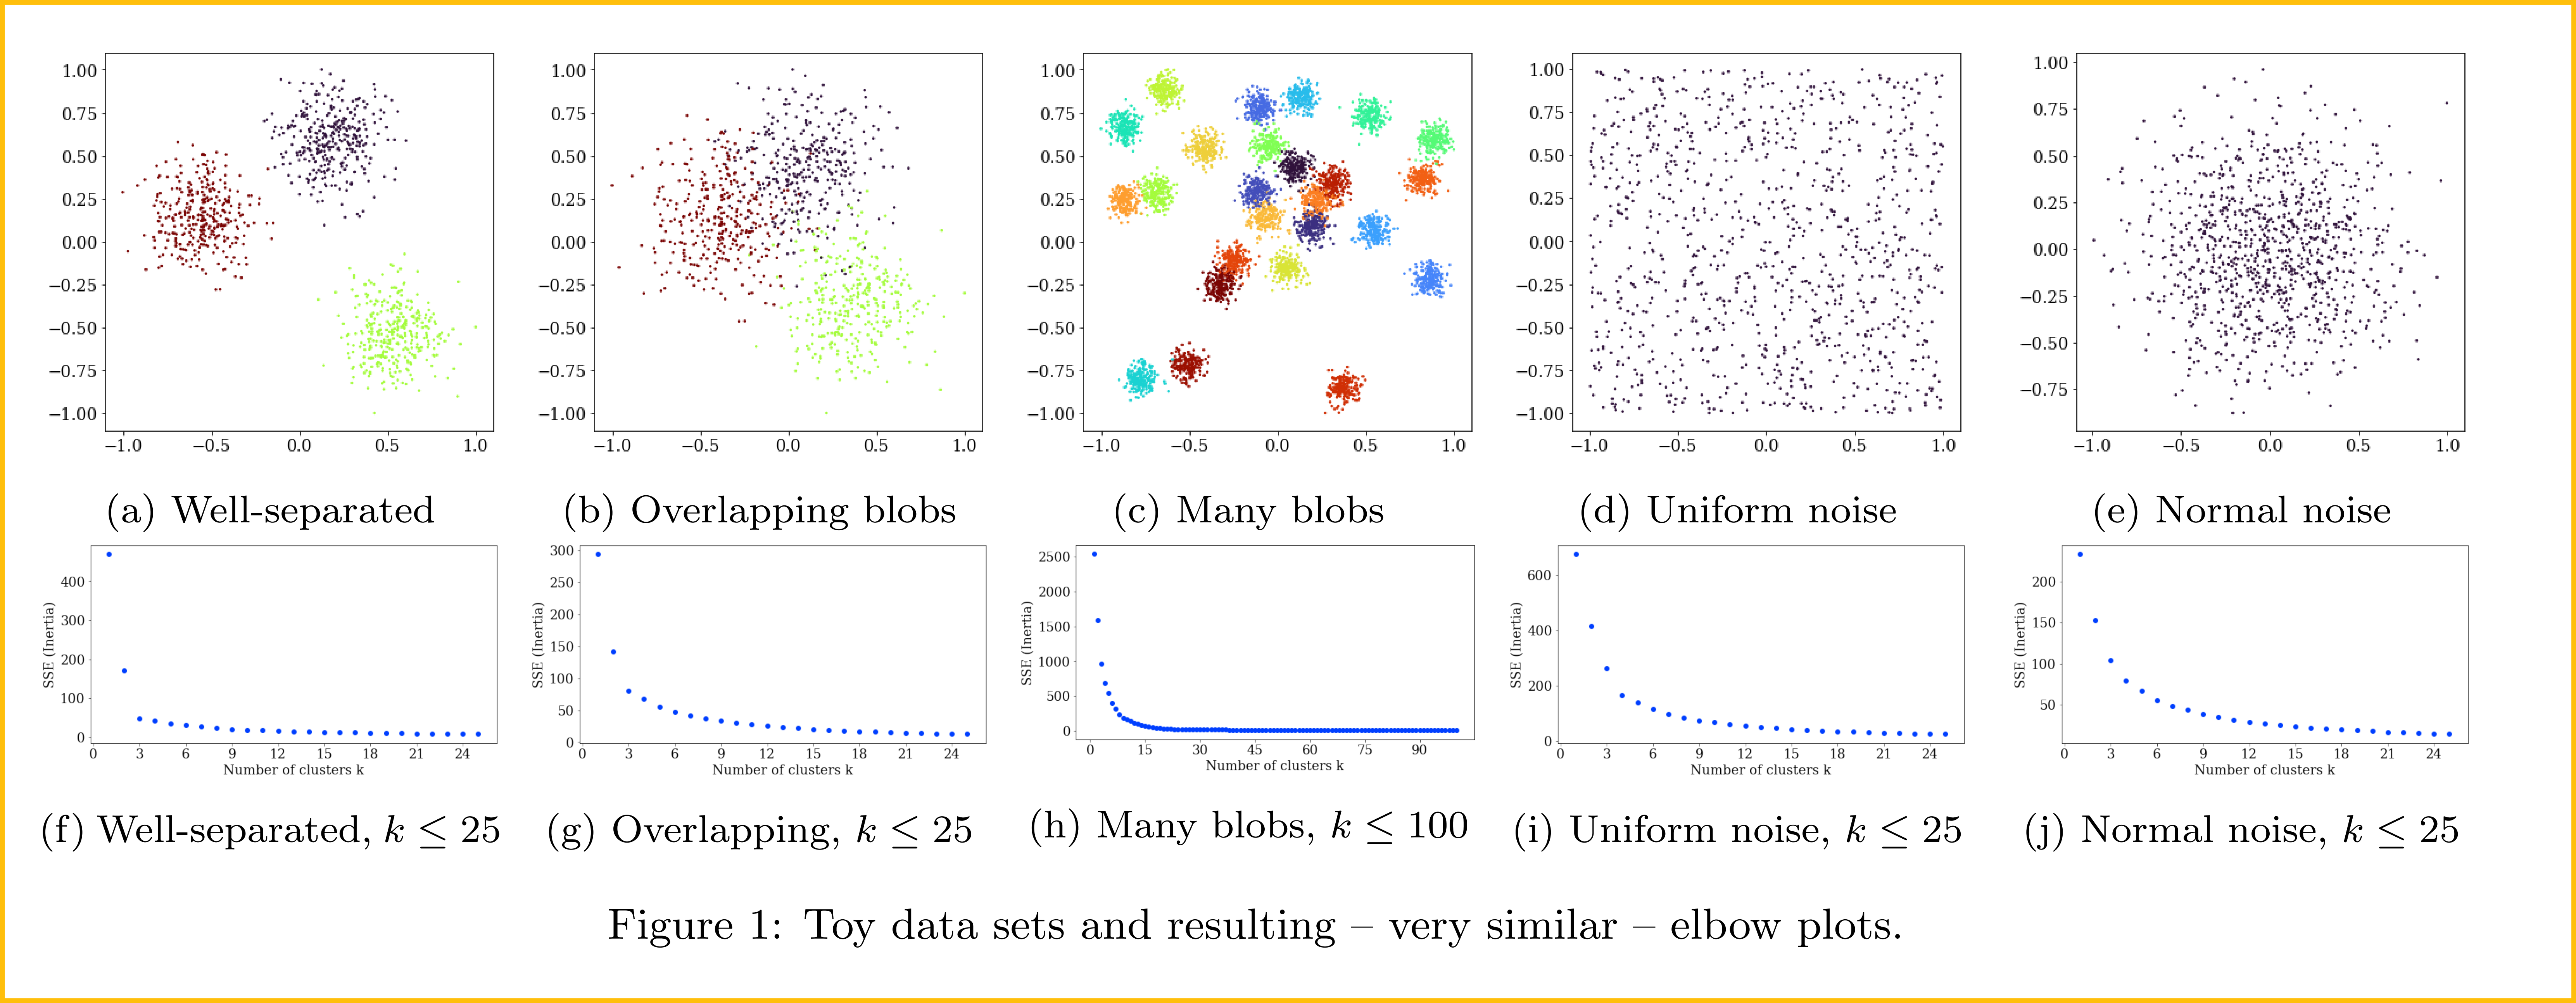
There are several problems associated with the elbow plot, that statisticians know too well from the scree plot. Because the axes of the plot have very different meanings, we cannot compare them well. We do not have a meaningful measurement of angle, and changing the scaling of the axes (and, e.g., the parameter range of k) may well change the human interpretation of an “elbow” (View Highlight)
We observe that all methods were able to recognize the best solution on the well-separated data set, and even on the more overlapping version, they all worked – for a small enough maximum k. For the data set with many clusters as well as the uniform data set, all the elbow-based methods failed. (View Highlight)
As we are not convinced that the “novel” approach we constructed above is clearly superior to VRC, BIC, or the Gap statistic, we suggest that you simply use one of these approaches to choose k, and rather pay attention to the way you preprocess your data for k-means. because “garbage in, garbage out” – if your data is not prepared well, none of the clustering results will be good. (View Highlight)
The observation of interest is that in k-means we somewhat assume that all clusters have the same spherical shape. This is simply a consequence of the sum of squared errors (Eq. 1) not including any weights depending on the cluster or axis. This is a reasonable simplification if we assume that our data set was generated from k pure signals (corresponding to the cluster centers) plus i.i.d. Gaussian noise. This also leads to many situations where k-means will not work well: for example (i) if the axes have very different scales, and clusters are separated on the scales of low variance as in Figure 4a, (ii) if the cluster diameters are very different, yet the clusters are close, as in Figure 4b and (iii) when the clusters are not generated by Gaussian errors around an origin but have a non-convex shape as in Figure 4c and common in geodata, (iv) there are correlations in the data and some directions are more important than others, as in Figure 4d, (v) the input data is not continuous, or (vi) the similarity of objects is not well captured by Euclidean distance. (View Highlight)
When dealing with complex data, such as text data, it is fairly common that we first have to “vectorize” it, for example using TF-IDF, and/or applying some dimensionality reduction technique such as principal components analysis (PCA). Figure 4e shows such a data set, containing 5 groups from the well-known 20newsgroups data set, reduced to two dimensions with TF-IDF and PCA. (View Highlight)
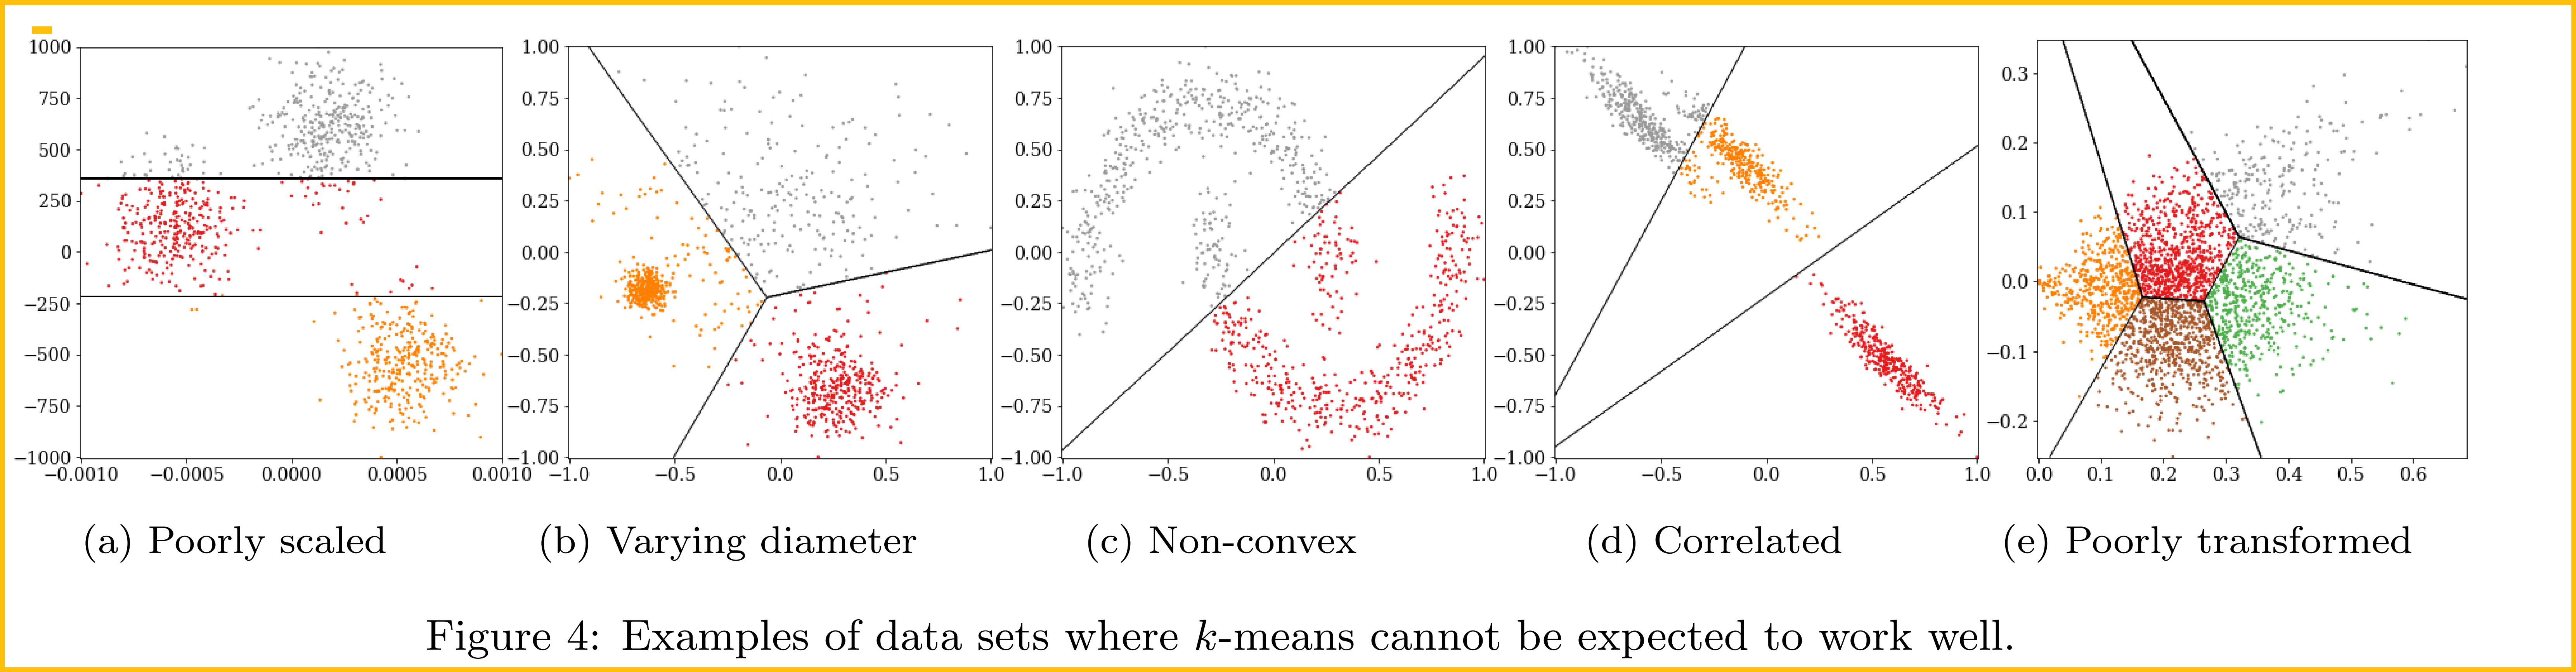 (
(In this case, all signal suitable for clustering was destroyed by this na¨ıve preprocessing – yet this is a common combination of preprocessing techniques recommended in various blogs. (View Highlight)
The first two cases and the fourth case can be solved much better by using Gaussian mixture modeling [8], in the third case – common for example in data that follows geographic features – DBSCAN [11; 35] and other density-based clustering algorithms often are a better choice. (View Highlight)
For (v), the choice of a suitable clustering algorithm tends to become difficult, although modifications of k-means to categorical variables exist, for example, the k-modes algorithm [16]; (View Highlight)