Metadata
- Author: Ergest Xheblati
- Full Title:: Lessons Learned Implementing Metric Trees
- Category:: 🗞️Articles
- Document Tags:: Metric trees,
- URL:: https://sqlpatterns.com/p/lessons-learned-implementing-metric
- Finished date:: 2024-12-01
Highlights
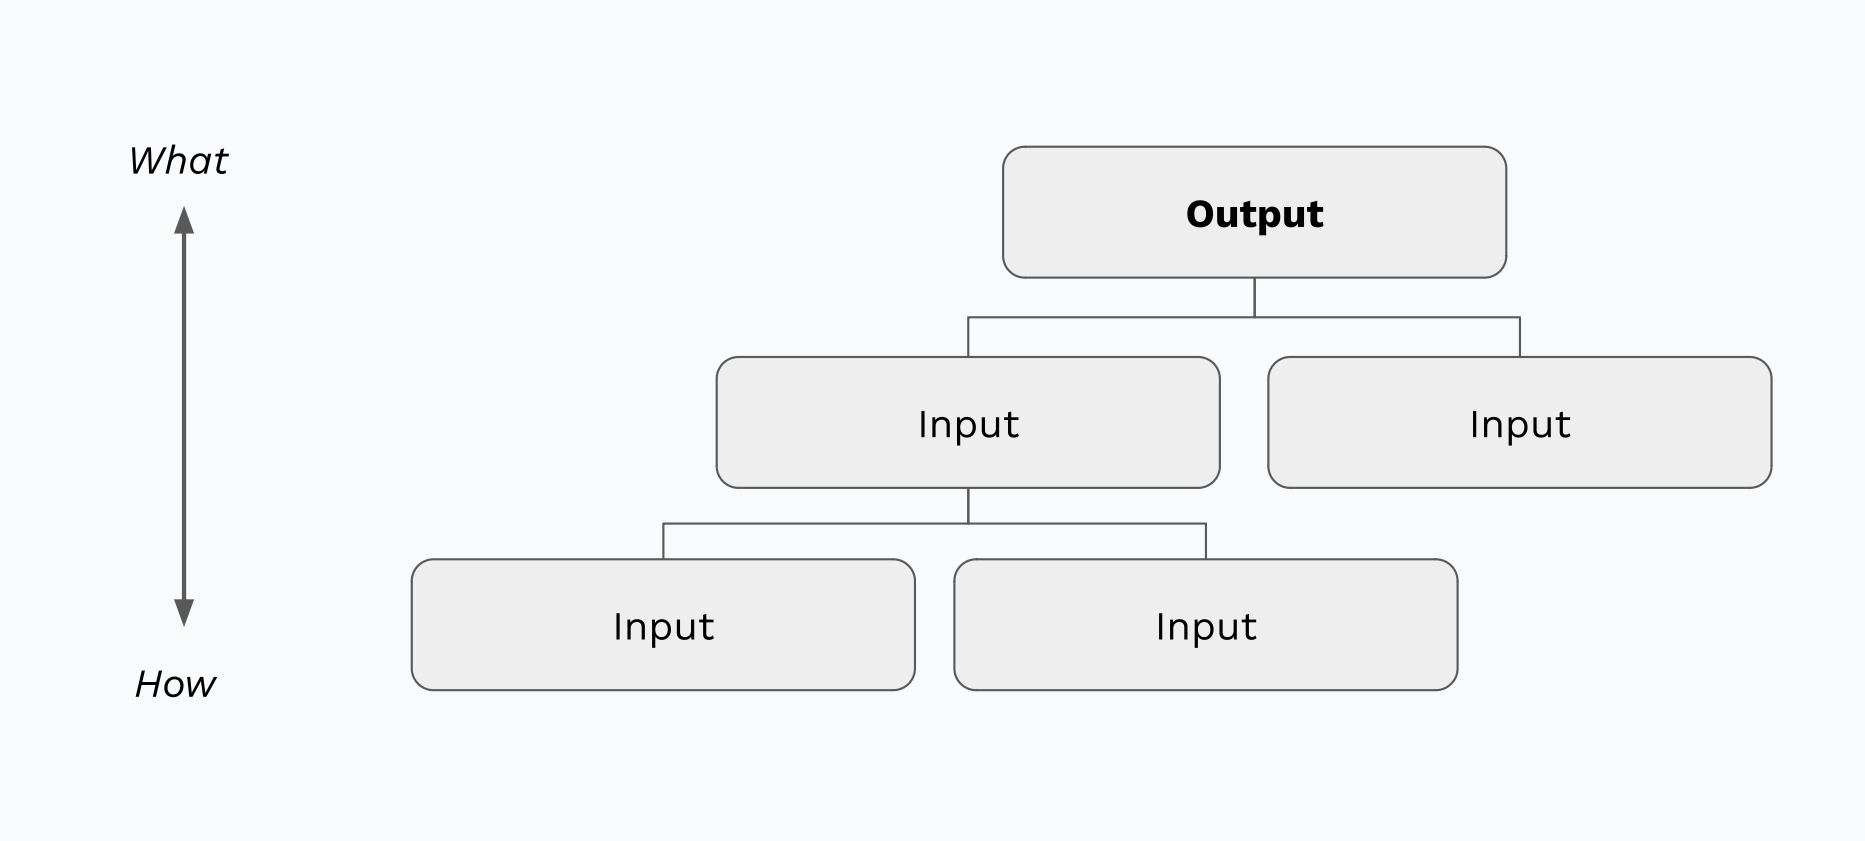
Emma: I started by identifying our North Star metric, which was straightforward—it’s revenue. From there, I broke revenue down into components that directly impact it, like Monthly Transacting Users (MTUs) and Average Revenue Per User (ARPU). I then broke down MTUs by new and returning users because their behaviors impact revenue differently. Me: That’s interesting. I would have thought that splitting a metric along a dimension like that would make the tree more dense and complicated. Why did you choose to split MTU into new and returning users? Emma: Historically, we’ve focused heavily on acquiring new users, like many startups. But we realized that retaining existing users is equally important for sustainable growth. By explicitly highlighting both segments in the tree it ensured that strategies for retention received as much attention as acquisition. (View Highlight)
Emma: I considered adding dimensions like channels directly into the tree, but it quickly became complex. So I limited the levels of the tree to keep it simple—no more than four levels, including the North Star metric. We only use those dimensions when doing something like root cause analysis where you would drill down into specific metrics. This way, the tree remained relatively high level rather than an exhaustive map. (View Highlight)