Metadata
- Author: Ergest Xheblati
- Full Title:: Debugging Your Business With Data
- Category:: 🗞️Articles
- Document Tags:: Data Analysis, Metric trees,
- URL:: https://sqlpatterns.com/p/debugging-your-business-with-data
- Finished date:: 2024-04-21
Highlights
That’s why, as Cedric explains, the WBR is done deliberately in the direction of causes → effects (input metrics → output metrics). (View Highlight)
Ankur: So the first thing we did was try to contextualize it – how much of an anomaly is this metric? The most important question in root cause analysis is actually just: “does this even matter?” (View Highlight)
the changes in a metric as resulting from 5 possible causes: (View Highlight)
Component Drift, which is when the algebraic components of a metric have changed (View Highlight)
Seasonality, (View Highlight)
Segment Drift (View Highlight)
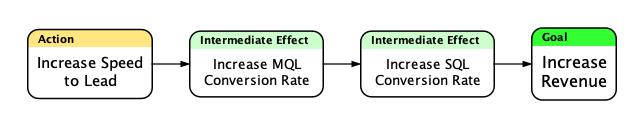
Influence Drift, which is when a metric is moving because some probabilistic driver upstream has changed. Abhi’s favorite example is that speed-to-lead influences conversion rates and changes in speed-to-lead can therefore result in changes to conversation rates. (View Highlight)
Event Shocks, which is when some kind of event has taken place within the company or outside the company that has disrupted key processes. For example, a new product launch or pricing change has changed the level of interest the market has in our products. (View Highlight)
The point of RCA is to bound the search space – it’s to use quantitative methods to “shine the flashlight” on where to deploy the last-mile qualitative investigation (View Highlight)
Ankur: Yeah, I want to underscore the “robust framework” piece here. When I’ve done RCA in the past, it has always been hypothesis-driven – start with a bunch of hypotheses based on things we’ve seen before – seasonality, cohort “bake time”, etc., and see whether those seem to align with the reality we’re looking at. (View Highlight)