Metadata
- Author: Erik Bernhardsson
- Full Title:: Conversion Rates – You Are (Most Likely) Computing Them Wrong
- Category:: 🗞️Articles
- URL:: https://erikbern.com/2017/05/23/conversion-rates-you-are-most-likely-computing-them-wrong.html
- Finished date:: 2024-05-01
Highlights
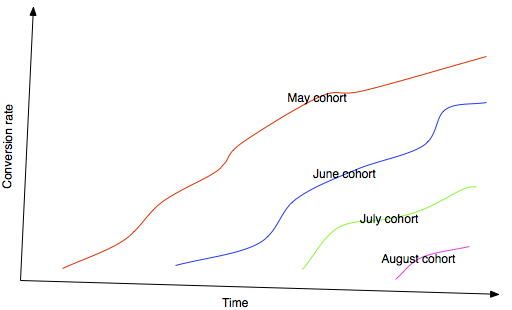
The “insight” I had was when I started breaking it up into cohorts. For instance, look at all users that joined on May 1 and track their conversion rate over time (View Highlight)
The beautiful thing that happened was that the conversion rate keeps growing and growing over time. People converted at an almost uniform rate over the first few years (View Highlight)
My lesson here is that conversion rates are sometimes pointless to try to quantify as a single number. Sometimes it’s a useful metric, but in many cases it’s not. Spotify’s conversion rate is not that useful to know in itself, since the user base is not in equilibrium. As long as the user base keeps growing, and as long as there’s a substantial lag until conversion, you really can’t say anything by trying to quantify it into a single number. (View Highlight)
Both of these charts underlines that there’s often no such thing as a single “conversion rate” and no such thing as a “time to conversion (View Highlight)
But in many cases, including the case of startup exits, as well as Spotify free to Premium, “conversion rate” and “time to conversion” is nonsensical and cannot be defined. (View Highlight)
I’m not sure what’s the “official name” of a plot like this, but generally people refer to it as a cohort plot. For every cohort, we look at the conversion rate at time T (View Highlight)
The 😎 way to look at conversion rates – Kaplan-Meier (View Highlight)